
Table of contents
When it comes to programming, people sometimes forget about simple and quick solutions that can make life a lot easier. I would remind you not to underestimate the power of Excel! In this article, we will build a small dashboard with regression test results for Android, iOS and API and a list of bugs found during testing.
Calculations
Test Suite
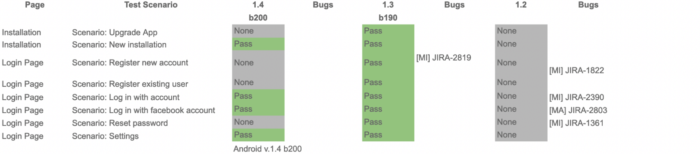
We will start our Google spreadsheet journey with the calculations tab. Our solution will be divided into separate Android, iOS and API tabs. Each contains a regression tests list (Figure 1). Each test’s execution has its own app version number.
In the [Bugs] column, we will store bugs found during regression. Bugs will have a defined pattern [“Severity”] JIRA-XXXX. “Severity” will be then replaced by 5 available options (MI, MA, TR, BL, CR) which correspond to Minor, Major, Trivial, Blocker and Critical respectively.
Calculations
Below the Test Suite, we will make some calculations for the dashboard (Figure 2). Starting with test results per version and the total number of tests executed. For the sake of simplicity of the dashboard, the “Executed” means Pass+Fail excluding None.
- “Fail” – using formula: =COUNTIF(C3:C11, “*Fail*”) etc.
- “Executed” – using formula: =sum(C13:C14)
Next we will calculate the number of bugs by severity and version:
- “Total Bugs” – using formula: =COUNTIF(F3:F11, “*JIRA*”)
- “Critical” – using formula: =COUNTIF(D3:D11, “*[CR]*”) etc.
We then sum all bugs (by severity and total) in the last column.

Dashboard
Executed Tests
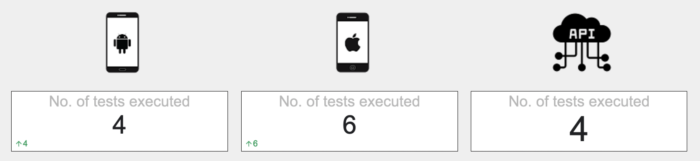
The first section contains a number of tests executed from the last build (Figure 3). We use the “Executed” field to plot values.
Bugs by severity
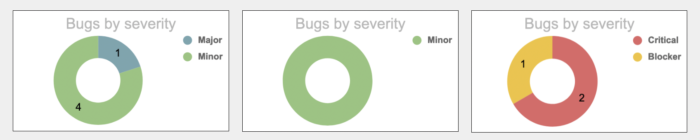
The next section contains the number of bugs by severity (Figure 4). We use values of the last column with summed bugs: Critical, Major, Minor etc. The plots have defined colors for each severity of the bug.
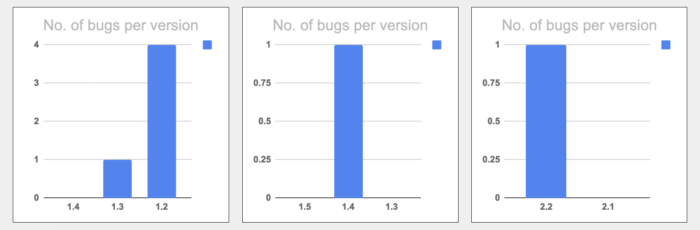
Bugs per version
The last section contains the number of bugs per version (Figure 5). We take the values of the “Total Bugs” field counted for each app version.
The result
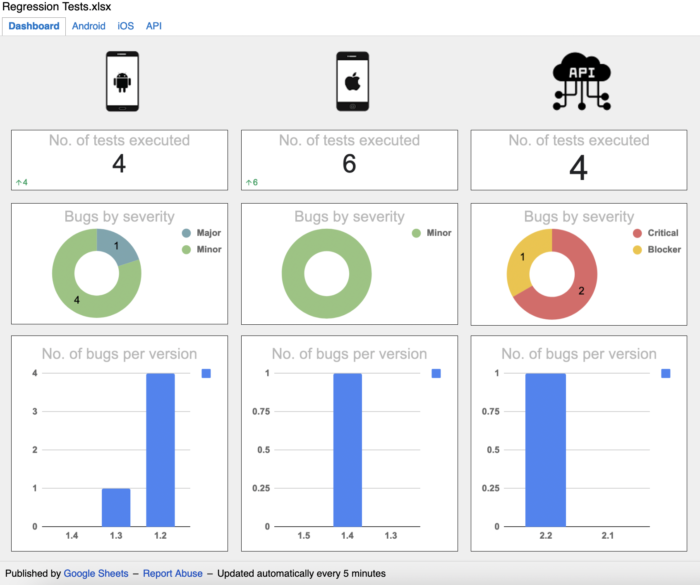
The complete dashboard is displayed in Figure 6. It took 2-3 hours with little Google spreadsheet knowledge. The Google spreadsheet is then converted to an html link and is made accessible to “invited” people. The html link contains the dashboard and all tabs we want to display.